Qlikview


Leave a comment

Subset Ratio


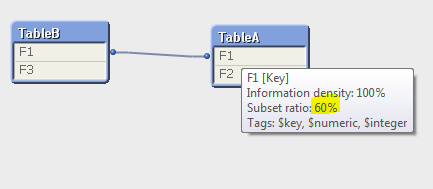
Subset Ratio is the number of unique occurrences in the table in question as compared to the total number of unique occurrences in all tables. See the example below there are five unique occurrences in the field F1 (numbers 1-5). The subset ratio in table A is 60% (3/5, ie 3 unique occurrences as compared to 4 rows in the table). In table B the subset ratio will be 80% (numbers 1, 2, 4 and 5 as compared to the total the numbers 1-5, ie 4/5).


A:
LOAD * INLINE [
F1, F2
1, A
2, B
3, C
3, Cbis
];

B:
LOAD * INLINE [
F1, F3
1, I
2, II
4,  IV
5, V
];

subset2 subset1


Leave a comment

Information Density

Information Density represents percentage of records that have not NULL values for a field.

Example:

country
code
Afghanistan AF
Albania
Algeria DZ


After loading the above records, go to the table viewer section (CTRL+T)

mouse hover on “country” field, you will see Information density is 100%

Now mouse hover on “code” field, you will see Information density is less than 100% i.e 67%

It means that, code field contains a null value in 2nd row that’s why it is showing Information density is 67%


Leave a comment

Primary Key and Perfect Key

Perfect Key:

It indicates that every row contains a key value, and that all of these key values are unique. At the same time, the field’s subset ratio is 100 percent. This qualifier should be seen in dimension tables, where every key should uniquely identify a single record.

Primary Key:

It indicates that all key values are unique, but not every row contains a key value or the field’s subset ratio is less than 100 percent.

Key:

It indicates that the key is not unique. This qualifier is usually seen in fact tables, where the same dimension value may be associated with many different facts.


Design a site like this with WordPress.com
Get started